Advertisement

BACK TO ALL NEWS

PALOS VERDES, CA — The evolution of factory dashboards has been fast and furious as technological developments in the manufacturing space accelerate faster than ever. Today’s technology gives bakers the capability to analyze real-time data from almost anywhere, meaning operational decisions and course corrections can be made quickly, improving efficiencies and saving money.

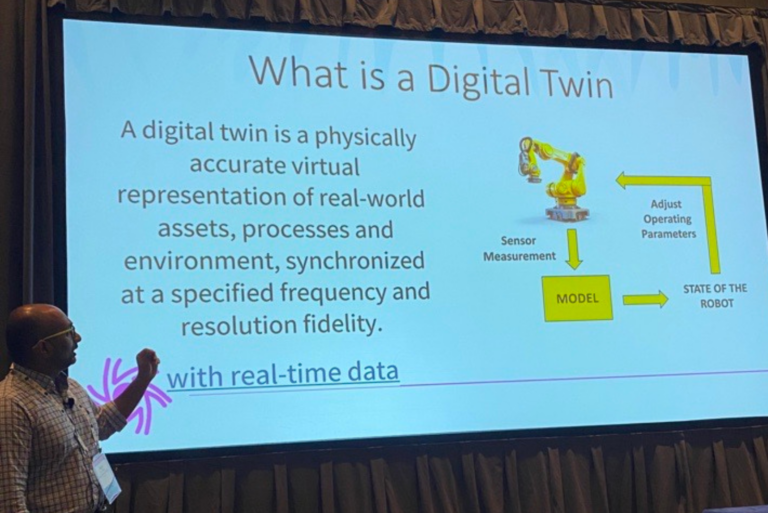
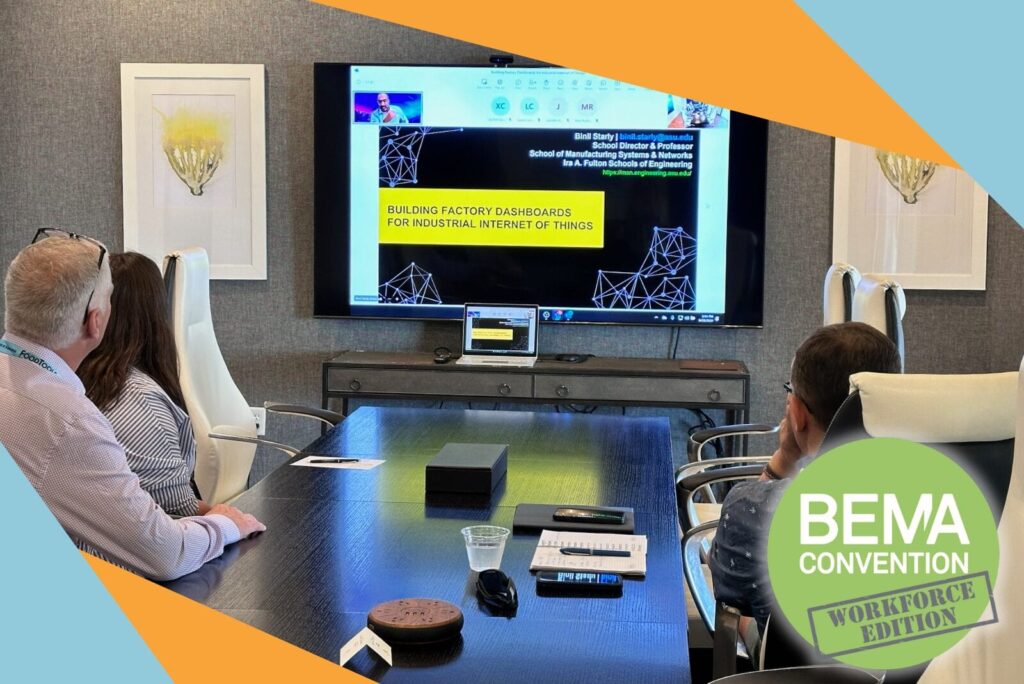
As part of the virtual Workforce Edition of BEMA’s annual convention, taking place June 28-July 2 in Rancho Palos Verdes, CA, Binil Starly, a professor at the School of Manufacturing Systems and Networks at Arizona State University, discussed the capability range of factory dashboards during his session, Building Factory Dashboards for the Industrial Internet of Things.

“Factory dashboards are communication tools that enable a visual display of factory data ­– production yield, safety issues, equipment effectiveness — from multiple sources,” Starly explained. “Prior technology was all about single-source. Today, we have intelligent machines that can bring all kinds of data together in a single dashboard that allows you to make decisions at all levels within the factory.”

Advertisement

Use cases for real-time factory dashboards cover a wide range of applications, from conveying machine status to production floor personnel, to simulating what-if scenarios for production line operations, to incorporating prior data for long-term predictive and prescriptive analysis.

“These dashboards can be customized based on who is actually looking at it: an operator, the plant manager, the production manager or leadership,” Starly noted.

The session provided insight into four dashboards commonly used in manufacturing: Grafana, AzureDT, FlexSim and Issac Sim. They range from simplistic 2D and 3D models to the more advanced dashboards used by larger companies such as Amazon and Walmart, which tend to have their supply chains locked down and interoperability and standardization issues addressed.

“These dashboards can be customized based on who is actually looking at it: an operator, the plant manager, the production manager or leadership.” Binil Starly | professor at the School of Manufacturing Systems and Networks | Arizona State University

Advertisement

Starly noted that the type of dashboard a company uses depends on its needs and capabilities. Most companies start with a 2D dashboard framework like Grafana and scale up as needed, with the next step often being a digital twin platform, such as Azure, which runs in the cloud and offers remote analysis features.

“This relates to knowledge graphs,” Starly said. “Azure works on understanding how the data is interconnected so you need to have some sort of backend organization of the data. This platform is more for the managerial level or the c-suite, which is looking at operational status of global factories.”

Advertisement

In closing the session, Starly addressed questions from virtual attendees about data security and strategies for mitigating risk.

“There are multiple elements,” he said. “It starts with looking at the vulnerabilities and potentially where data can be mishandled or misrepresented, and working with partners such as your cloud providers to lockdown who has access to data. It has to be a well thought out process and not taken for granted.”

Factory dashboards have come a long way in a short time. Once seen as futuristic, integrating digital twin technology and advanced analytic tools to improve manufacturing and supply chain processes is very much a reality for commercial bakers today.

Advertisement